
By Daniel Borkert, FNP-C
Last reviewed October 22, 2026. Figures checked against the sources named below on October 22, 2026.
My first two offers were $100,000 and $110,000. I took the higher one, and I had no real idea whether either of them was good. Every salary figure on the page carries its source and its data date, because salary pages usually fail in one simple way. They mix a median from one year, a mean from another, and a job board average from last week, and present the blend as one number. Where this page combines sources, or the years behind two figures differ, it says so at the figure. Where two honest sources disagree, both figures are shown and the difference is explained.
In this guide
- The short answer
- How to read these numbers
- The national picture
- Nurse practitioner salary per hour
- Nurse practitioner salary by state
- Nurse practitioner salary by setting
- Nurse practitioner salary by specialty
- What moves an individual offer
- A short word on negotiation
- Reading an actual offer against this data
- Get the figures in your inbox
- Frequently asked questions
- Sources for this page
The short answer
Nurse practitioners in the United States earn a median annual wage of $132,300, and a median hourly wage of $63.61. The mean annual wage is $137,300, pulled above the median by high earners in acute care, procedural, and high cost states. The middle half of nurse practitioners earn between $117,990 and $156,700 a year. All four figures are from the Bureau of Labor Statistics Occupational Employment and Wage Statistics program, May 2025 release, for nurse practitioners, occupation code 29-1171.
| Figure | Amount |
|---|---|
| Median annual wage | $132,300 |
| Mean annual wage | $137,300 |
| Median hourly wage | $63.61 |
| 25th percentile | $117,990 |
| 75th percentile | $156,700 |
| 10th percentile | $101,340 |
| 90th percentile | $174,420 |
Notes for this table are at the bottom of this page.
The sections below unpack what moves a given nurse practitioner toward the bottom or the top of that spread. Specialty gets a short treatment here, because this site keeps the full specialty ranking on its own page. State, setting, and experience get full treatment here, because those are the levers a working nurse practitioner can actually compare against an offer letter.
How to read these numbers
Five factors will keep any salary figure honest, on this page and everywhere else.
First, know whether a figure is a median or a mean. The median is the midpoint earner. Half of nurse practitioners earn more, half earn less. The mean is an average, and in a profession with a long high earning tail, the mean sits above the median. A page that quotes the mean as the typical salary overstates what a typical offer looks like by about $5,000 a year at current figures.
Second, know the data date. Wage surveys describe the past. The May 2025 BLS release is the most recent full national wage survey for this occupation as of this page’s review date, and it replaced a May 2024 median of $129,210. The year to year move was about 2.4 percent. Any page still quoting $129,210 is a year behind, and any page quoting a figure with no date at all should be read with suspicion.
Third, know what a wage survey counts. BLS wage figures are straight time gross pay, not total compensation. They include base pay and incentive pay, including commissions and production bonuses. They exclude overtime premiums, severance pay, shift differentials, nonproduction bonuses such as sign-on bonuses, on-call pay, and the employer’s cost of benefits, which in hospital employment can be worth a substantial share of total compensation. Two offers with identical salaries can be very different jobs once call pay and differentials are counted.
Fourth, know the source type. BLS figures come from an employer survey and describe what employers report paying. Job board figures come from current postings and self reports, move daily, and skew toward employers who are hiring hard. Survey figures from compensation firms describe the respondents who chose to answer. This page leads with BLS wherever BLS publishes the cut, and names any secondary source where it does not.
Fifth, know whose pay is being counted. BLS counts nurse practitioners as their own occupation. Nurse anesthetists and nurse midwives are separate occupations with their own figures, and none of their pay is in the numbers on this page.
Inside the nurse practitioner occupation, BLS publishes no split by specialty, so every figure here blends family practice, psychiatric, acute care, pediatric, and the rest in the mix employers actually reported. That blending is why the specialty section further down rests on named compensation surveys instead, and why a state figure describes a workforce rather than a single job. The survey also covers employees only, so income from practice ownership sits outside it entirely.
The national picture
About 336,300 nurse practitioners held jobs in the United States in 2025, per Bureau of Labor Statistics employment data. The occupation is projected to grow 41 percent from 2025 to 2035, adding about 137,800 jobs, one of the fastest growth rates in the economy. That is a projection about the coming decade, not a measurement of today’s labor market, and this page reports it as a projection only. Its practical meaning for a reader weighing an offer is narrower: employers expect to keep hiring into a credential that takes years to produce.
The distribution itself is worth reading slowly. The 10th percentile sits at $101,340, which means nine out of ten nurse practitioners earn more than that. The middle half of the profession earns between the 25th percentile at $117,990 and the 75th percentile at $156,700. That spread is a snapshot of the whole workforce at one moment, not a map of any one career. Where a given clinician sits inside it depends on specialty, setting, state, and hours, and BLS publishes no split by experience that would let this page say more than that.
The top tenth earn above $174,420. Figures beyond that, the $200,000 salaries that circulate in forums, exist, but they concentrate in a few places, high cost states, acute care and procedural roles, locum tenens contracts, and practice ownership, and they are not the shape of a typical employed offer.
One comparison puts the occupation in context. Registered nurses earned a median of $97,550 in May 2025, and physician assistants earned a median of $135,880, both per BLS. The nurse practitioner median of $132,300 sits about $34,750 above the registered nurse median. It sits just below the physician assistant median, a gap small enough that setting and state routinely reverse it in individual offers.
Nurse practitioner salary per hour
The median hourly wage is $63.61, BLS OEWS, May 2025. The annual median assumes full time, year round work at 2,080 hours, so the hourly figure is the better tool for anyone comparing part time, per diem, or contract offers.
Hourly pay in practice varies more than the median suggests. Per diem and locum tenens work usually pays a higher hourly rate than a salaried role in the same market, in exchange for no benefits, no paid leave, and no schedule guarantee. Salaried roles quote an annual figure but are worked in hours, and a salaried clinic job with a four day week can be worth more per worked hour than a higher annual figure attached to a five day week with evening call.
When you compare offers, convert everything to an hourly rate at your actual expected hours, including call, before you compare the totals. It is the comparison least likely to lie to you, because it prices the job you will actually work rather than the job as titled.
Nurse practitioner salary by state
State is one of the largest single drivers of pay, and it is the driver new graduates most often misjudge, because the highest nominal wages sit in the highest cost states. The table below lists the annual mean wage for every state and the District of Columbia, from the BLS OEWS May 2025 release, in descending order. State figures are shown as means, and they are labelled as means throughout, so they are never confused with the national median above.
| State | Annual mean wage |
|---|---|
| California | $176,760 |
| Oregon | $155,780 |
| New Jersey | $155,750 |
| New York | $153,900 |
| Massachusetts | $152,320 |
| Washington | $152,180 |
| Alaska | $149,120 |
| District of Columbia | $146,470 |
| New Mexico | $143,510 |
| Rhode Island | $143,150 |
| Hawaii | $142,910 |
| Connecticut | $142,340 |
| Arizona | $140,600 |
| Vermont | $139,400 |
| New Hampshire | $138,070 |
| Nevada | $137,410 |
| Utah | $137,060 |
| Iowa | $136,940 |
| Minnesota | $135,890 |
| Montana | $135,290 |
| Wisconsin | $135,160 |
| Maine | $134,210 |
| Oklahoma | $134,200 |
| Idaho | $133,420 |
| Maryland | $133,360 |
| Delaware | $132,900 |
| Michigan | $132,790 |
| Wyoming | $132,680 |
| Colorado | $132,540 |
| Pennsylvania | $132,070 |
| Nebraska | $131,710 |
| Texas | $131,420 |
| Missouri | $130,970 |
| Illinois | $130,940 |
| North Carolina | $130,870 |
| Florida | $130,410 |
| Arkansas | $130,260 |
| Virginia | $129,060 |
| Georgia | $128,800 |
| Kansas | $127,940 |
| West Virginia | $126,780 |
| Louisiana | $126,630 |
| Indiana | $126,600 |
| North Dakota | $126,370 |
| Mississippi | $125,340 |
| South Dakota | $125,160 |
| Kentucky | $125,010 |
| South Carolina | $124,170 |
| Ohio | $122,910 |
| Tennessee | $115,510 |
| Alabama | $110,970 |
Notes for this table are at the bottom of this page.
Read the table with cost of living in hand. California’s mean runs about $65,800 above Alabama’s, and California prices consume much of that difference in the metros where the jobs are.
The more useful reading is the middle of the table. Texas and Florida pay near the national median, and they employ more nurse practitioners than almost any other state, Texas the most at about 26,000 and Florida about 21,800, which makes them the markets where a typical offer is easiest to benchmark. A nurse practitioner weighing a move should compare the specific offer against the state mean, then discount it mentally for local housing costs, rather than chasing the top row of any state table.
Pay after cost of living
That mental discount can be done with published numbers. The Bureau of Economic Analysis publishes Regional Price Parities by state, a price level index where 100 equals the national average. Dividing each state’s May 2025 mean wage by its price parity gives the wage restated in national average dollars. The price parities are the most recent BEA release and describe 2024, one year behind the May 2025 wages, and that gap is stated here rather than hidden because no fresher edition of this series exists.
Read the adjusted figures as a comparison tool. Prices vary inside every state, and a state mean blends metro and rural jobs on both sides of the division, so no adjusted figure predicts pay in a specific city.
| Adjusted rank | State | Mean wage, May 2025 | Price parity, 2024 | Adjusted mean wage |
|---|---|---|---|---|
| 1 | California | $176,760 | 110.7 | $159,646 |
| 2 | Iowa | $136,940 | 87.8 | $156,036 |
| 3 | New Mexico | $143,510 | 92.2 | $155,631 |
| 4 | Oklahoma | $134,200 | 87.8 | $152,773 |
| 5 | Oregon | $155,780 | 103.4 | $150,714 |
| 6 | Arkansas | $130,260 | 86.9 | $149,833 |
| 7 | Nebraska | $131,710 | 90.1 | $146,177 |
| 8 | Alaska | $149,120 | 102.4 | $145,683 |
| 9 | Missouri | $130,970 | 90.8 | $144,213 |
| 10 | Mississippi | $125,340 | 87.0 | $144,147 |
California keeps first place, and that is the most useful correction in this section. The common reading that California pay is an illusion created by California prices does not survive the arithmetic at state level, because the nominal lead is wider than the price gap. Behind California the order changes character. Six of the adjusted top ten rank eighteenth or lower on pay alone, and the new names are midwestern and southern states whose nominal pay looked ordinary. Iowa is second, Oklahoma fourth, Arkansas sixth, Nebraska seventh, Missouri ninth, and Mississippi tenth.
| Adjusted rank | State | Mean wage, May 2025 | Price parity, 2024 | Adjusted mean wage |
|---|---|---|---|---|
| 42 | Ohio | $122,910 | 92.8 | $132,483 |
| 43 | South Carolina | $124,170 | 93.7 | $132,449 |
| 44 | Illinois | $130,940 | 100.0 | $130,995 |
| 45 | Hawaii | $142,910 | 110.0 | $129,976 |
| 46 | Colorado | $132,540 | 103.1 | $128,615 |
| 47 | Virginia | $129,060 | 101.1 | $127,651 |
| 48 | Maryland | $133,360 | 105.0 | $127,059 |
| 49 | Florida | $130,410 | 103.4 | $126,105 |
| 50 | Tennessee | $115,510 | 91.9 | $125,732 |
| 51 | Alabama | $110,970 | 88.8 | $124,934 |
Want the full ranking? The free NP Pay by State one-pager has all 50 states and DC with the cost of living adjustment applied, not just the top and bottom ten. Get it by email.
The largest single moves run in both directions. Mississippi climbs 35 places, from forty-fifth on pay alone to tenth after adjustment, and Arkansas climbs 31 places, from thirty-seventh to sixth. Louisiana climbs 29 places to thirteenth. Hawaii falls furthest, 34 places from eleventh to forty-fifth, because its pay is good rather than exceptional while its price level is second only to California’s. The District of Columbia falls 31 places to thirty-ninth, New Hampshire falls 26 places to forty-first, and New Jersey and New York leave the top five for fourteenth and seventeenth.
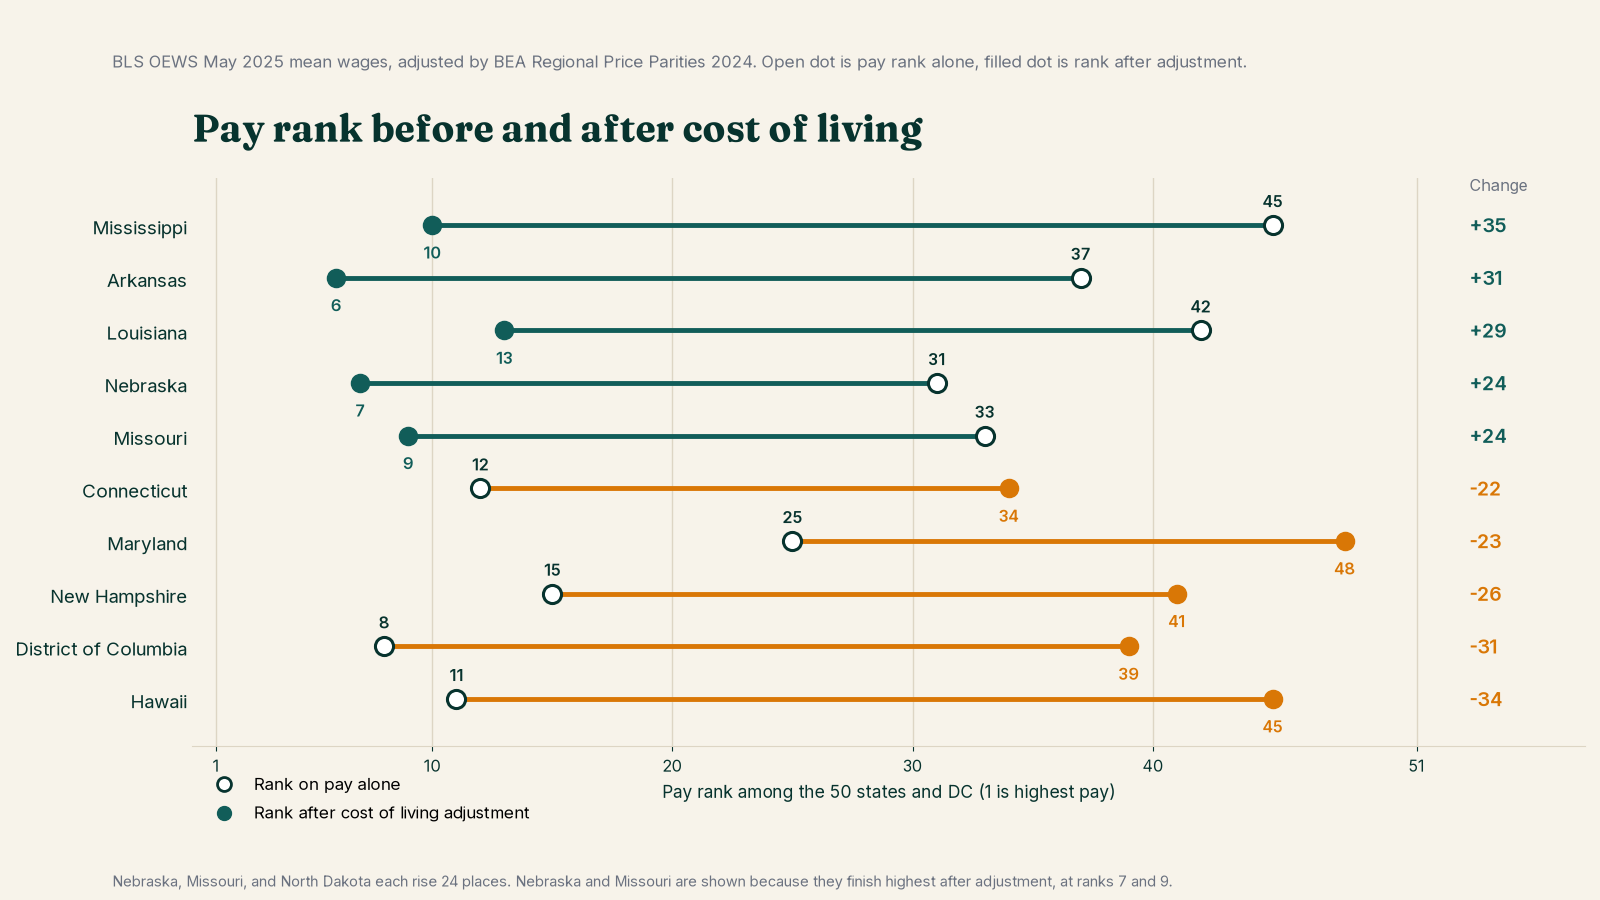
The bottom of the table barely moves. Alabama is last on pay alone and last after adjustment, and Tennessee is fiftieth on both lists, because low pay in a low cost state is still low pay. What adjustment changes most is the size of the gaps. California’s nominal lead over Alabama is about $65,800. After adjustment it is about $34,700. Adjusting for state price levels removes roughly half of the apparent gap between the two state means.
Nurse practitioner salary by setting
Setting is the second large driver, and it interacts with specialty, because high acuity settings are where the high acuity specialties work. The Bureau of Labor Statistics publishes industry wages for the combined group of nurse anesthetists, nurse midwives, and nurse practitioners in its Occupational Outlook Handbook, and the pattern in that combined data is consistent with what nurse practitioners see in individual offers, so it is shown here with its basis labelled rather than hidden.
| Setting | Median annual wage |
|---|---|
| Outpatient care centers | $143,370 |
| Hospitals, state, local, and private | $142,240 |
| Educational services | $135,170 |
| Offices of physicians | $131,940 |
| Offices of other health practitioners | $129,990 |
Notes for this table are at the bottom of this page.
Two readings matter. First, the largest single employer group in this combined data, offices of physicians at 46 percent of advanced practice jobs, sits second from the bottom of this table. Only offices of other health practitioners, at $129,990, pay less. A large share of advanced practice clinicians work in a setting near the bottom of the pay table, which is worth knowing before you assume a hospital offer is generous or a clinic offer is cheap.
Second, the gap between the top and bottom of this table is about $13,000, which is real money but smaller than the state gap and smaller than the specialty gap. Setting alone rarely rescues a weak offer, and it rarely ruins a strong one.
What the table cannot show is the texture. Hospital roles more often carry shift differentials, weekend premiums, and call pay on top of base, none of which appears in these wage figures. Clinic roles more often carry predictable hours. Comparing a hospital base against a clinic base without asking about differentials and call is comparing half of each offer.
Post-acute care runs on a different mechanism, and my pay history is the evidence I know best. My visits are priced by the Medicare Physician Fee Schedule, and that schedule has no inflation update built into it. Its conversion factor fell from $36.09 in 2020 to $32.35 in 2025, and nurse practitioners billing under our own number are paid 85 percent of the physician amount. The nursing home’s separate Medicare per diem is a different stream entirely. Its net payment updates rose in each final rule from fiscal 2023 through fiscal 2026, but that money pays the facility, not my professional billing.
So my base pay has barely moved since 2018, and my raises have come only as productivity bonuses. That is my own market as I have lived it: a payment stream with no inflation update underneath a salary, held flat for eight years. When I started, my pay sat well ahead of the average nurse practitioner salary; the wider field has since caught up. I have covered some of the difference by working a little more, but the rate itself has not moved.
Nurse practitioner salary by specialty
Specialty is the third driver, and the one students ask about first. BLS does not publish pay by nurse practitioner specialty, so every specialty figure in circulation comes from compensation surveys, and surveys disagree with each other more than readers expect. This guide carries a summary only. The full ranking, the reasoning, and the tradeoffs live on the companion page.
| Specialty | Reported median |
|---|---|
| Neonatal NP | $150,000 |
| Psychiatric mental health NP | $145,000 |
| Acute care NP | $135,000 |
| Emergency NP | $135,000 |
| Family NP | $122,000 |
| Adult gerontology NP | $120,000 |
| Women’s health NP | $120,000 |
| Pediatric NP | $118,000 |
Notes for this table are at the bottom of this page.
Treat these as survey medians, not as promises. They describe full time practice as reported to survey compilers, they are not adjusted for state or setting, and a family nurse practitioner in California will out-earn the neonatal median in a low paying state. The honest use of this table is orientation. It tells you the shape of the spread, about $32,000 from the pediatric baseline to the neonatal top, and it tells you where to dig next, which is the ranking page and then your own state’s data.
What moves an individual offer
Experience, read through the distribution
BLS does not publish wages by years of experience, and any page that presents precise salary by year figures is estimating from survey self reports. This page will not do that, because the wage distribution cannot substitute for the missing data. The percentiles in the tables above describe the whole workforce at one moment. They are a cross-section, not a career ladder, and no band in them should be read as the new graduate band or the experienced band.
What the distribution can honestly tell a reader is the range of outcomes the market currently produces, from $101,340 at the 10th percentile to $174,420 at the 90th. Where an individual offer lands inside that range is driven by the levers this guide can measure, specialty, setting, state, and hours, together with experience in ways the published data does not separate out. The gains that come from changing specialty, setting, or state are visible in the tables on this page. What experience alone adds, this data does not measure, so this page does not price it. BLS publishes no wage split by experience, and any figure that claims to show one is an estimate built on something else.
Employment type
The same job pays differently depending on how you are engaged. A W-2 employed role bundles base salary with benefits, malpractice coverage, retirement matching, and paid leave, and the wage figures on this page describe that world. A 1099 contractor role quotes a higher rate and bundles nothing, and the contractor is buying their own malpractice policy, funding their own retirement, and absorbing their own unpaid time off.
Locum tenens sits at the far end, the highest hourly rates in the profession, paid for flexibility and for working where staffing has failed. None of these is the best choice in the abstract. The comparison only works when each offer is reduced to total annual value at your expected hours, including the benefits you would have to replace.
One package, taken apart
In 2018 I had two offers on the table. An outpatient primary care clinic in the Everett, Washington area offered $100,000. A post-acute care role in Tacoma offered $110,000, built around seeing fifteen patients a day. I took the post-acute role.
The $110,000 was never the whole pay. The original package added full benefits with healthcare, paid CME, licensing costs, malpractice insurance with tail coverage, and three weeks of time off, plus bonuses for extra patients seen. Call was essentially uncompensated, treated as part of base salary.
The company was later acquired, and the package changed shape. Paid CME went away. Time off increased, after hours and weekend call disappeared, and the bonuses for extra patients grew significantly. My schedule is one I set myself, with no minimum or maximum hours, and productivity is measured in patients seen and quality measures, not hours.
My base today sits in the $120,000s, with bonuses bringing total compensation to $140,000 to $180,000, and my actual work week often runs 25 to 35 hours, bought back by experience and efficiency, with daytime call amounting to one to three short phone calls. The pieces I would protect first are no after hours or weekend call, a clear and predictable bonus structure, and schedule flexibility. Employer stability belongs on the same list. Earlier in my career I worked for a startup, and the constant uncertainty was itself a cost.
Practice authority and ownership
In full practice authority states, nurse practitioners can practice without a collaborative agreement. But practice authority, practice ownership, and independent billing are three separate questions. Authority comes from the state practice act, ownership from state business and corporate practice law, and billing from payer enrollment and reimbursement rules, and a state can answer the three differently. Where they line up, ownership is one of the few routes that regularly takes nurse practitioner income above the employed distribution altogether. Owned practice income does not appear in wage surveys at all, because owners are not wage employees, which is one more reason the top of the survey distribution understates the top of actual nurse practitioner earnings. The tradeoff is that ownership income is business income, with business risk, overhead, and unpaid administrative work inside it.
A short word on negotiation
Salary negotiation for nurse practitioners is a small topic in search volume and a large one in a career. I have lived one anchoring myself, when an outside offer became a retention bonus and reset every pay conversation that followed it, a story told a few paragraphs down. A first salary deserves the same seriousness, because the conversations that follow it tend to start from it. The working principles are few and unglamorous. Benchmark against the state mean and the distribution band for your experience, not against a classmate’s offer in a different state. Negotiate the whole package, because call pay, differentials, CME time and money, and schedule are often more movable than base. Get the final terms in writing before you resign anywhere.
And remember the context you are negotiating in. Employers know the 41 percent growth projection too, and in my experience a tight hiring market is the strongest negotiating asset a nurse practitioner has. A polite, specific, data backed ask is a normal part of hiring a nurse practitioner in 2026, not an imposition.
A few years into my post-acute role, another company offered me a similar job with a large bonus package. I took it back to my current employer and negotiated a large bonus of my own, tied to staying at least another year. I am still there, years later. The lesson is not complicated. Retention money exists for experienced clinicians, and the credible way to learn whether it exists for you is to hold an outside offer your employer believes you might actually take.
Reading an actual offer against this data
The point of a guide like this is a single moment, an offer letter in your hand and a decision to make. Work through it in four steps.
First, place the offer against your state. Find your state’s mean in the table above and note where the offer sits relative to that mean. An offer at the state mean has met one reference point, the average across every nurse practitioner job in the state. That is a starting check, not a verdict, because the mean blends specialties, settings, and experience levels that a single offer does not. An offer well below it needs a reason, such as a residency style first year, a four day week, or a loan repayment benefit, and the reason should be visible in the package.
Second, place the offer in the distribution. The percentiles describe the whole workforce, not a career schedule, so use them as a range check. An offer sitting near the bottom of the distribution needs its explanation wherever you are in your career, and the explanation belongs in the package, not in the recruiter’s summary of it.
Third, adjust for setting and specialty using the tables above, in that order, because the setting table and the specialty table describe overlapping parts of the same gap and should not be stacked as if they were separate premiums. An acute care role in a hospital should sit above the national median on both counts, but it is one premium, not two.
Fourth, convert to total value. Add the employer retirement contribution, the value of paid leave you will actually take, CME money and time, malpractice coverage, and any call or differential pay you can reasonably forecast. Subtract what the role costs you that a salaried comparison role would not, such as a longer commute priced honestly or unpaid call nights. The offer that wins on base salary loses this calculation often enough that the calculation is worth the twenty minutes it takes.
One more check sits outside the arithmetic, and it is the one new nurse practitioners most often misjudge, in my experience. The largest gap is rarely the salary figure. It is underestimating what the role includes.
How much call, and whether it is paid. How many patients a day are expected. How a bonus actually triggers, in the written terms rather than the recruiter’s summary. And how stressful the workplace is, which is hard to price and easy to underestimate when you are new. The job is not an easy one, but it is rewarding in many ways, and the reward survives a hard look at the terms far better than a surprise.
If the offer still looks light after all four steps, the negotiation section above is the next read. The data on this page is the evidence base for that conversation, and it refreshes every year when the new BLS release lands.
Get the figures in your inbox
Salary data goes stale on a schedule. The BLS release updates once a year, and survey figures drift between releases. Get the one page version of the state table, NP Pay by State, with the national median and mean and every state’s mean, median, and hourly pay on a single sheet you can keep with an offer letter. Join the Practice Brief list and the sheet comes to your inbox, along with the updated figures when the next BLS release lands and the new practice and career guides as they publish.
Frequently asked questions
What is the average nurse practitioner salary?
The mean annual wage is $137,300 and the median is $132,300, BLS OEWS, May 2025. The median is the better answer to what a typical nurse practitioner earns, because the mean is pulled upward by high earners.
How much do nurse practitioners make per hour?
The median hourly wage is $63.61, BLS OEWS, May 2025. Contract and per diem rates run higher and carry no benefits.
Which state pays nurse practitioners the most?
California, at an annual mean wage of $176,760, BLS OEWS, May 2025, with the cost of living caveat covered in the state section above.
Do nurse practitioners make $200,000 a year?
A small minority do. The 90th percentile is $174,420 at May 2025 figures, so earnings above $200,000 sit above the 90th percentile wage and concentrate in high cost states, acute care and procedural roles, locum contracts, and practice ownership. It is a real outcome and a poor planning assumption.
How does nurse practitioner pay compare with physician assistant pay?
Closely. Physician assistants earned a median of $135,880 in May 2025 against the nurse practitioner median of $132,300, both per BLS. State, setting, and specialty reverse that order in individual markets every day.
Table notes
National figures table
1. Median annual wage and median hourly wage: Median, BLS OEWS, May 2025.
2. Mean annual wage: Mean, BLS OEWS, May 2025.
3. Percentile figures (10th, 25th, 75th, and 90th): BLS OEWS, May 2025.
Pay by state table: BLS OEWS, May 2025.
Pay by setting table: Median, combined APRN group, BLS, May 2025.
Pay by specialty table: Compensation surveys incl. CompHealth compiled data, 2025 to 2026.
Sources for this page
US Bureau of Labor Statistics, Occupational Employment and Wage Statistics, May 2025 release, nurse practitioners, occupation 29-1171, national and state wage estimates. US Bureau of Labor Statistics, Occupational Outlook Handbook, nurse anesthetists, nurse midwives, and nurse practitioners, pay and outlook sections, May 2025 data, including 2025 to 2035 employment projections. US Bureau of Labor Statistics, OEWS May 2024 release, for the prior year median. Compensation surveys including data compiled by CompHealth, 2025 to 2026, for specialty medians, which BLS does not publish. Full claim by claim sourcing is kept with this page’s production file and checked at every refresh.
Board & Bedside also makes FNP board prep for students and new graduates. The question bank, flashcards, and mock exam are in our shop.
Leave a Reply